Yesterday we released the latest version of our flagship product, Visual Fusion. Visual Fusion 5.0 is a very exciting milestone for us—and for our customers. The new visualization, contribution, and SharePoint integration features break new ground in business intelligence software.
I thought I’d show off some of the highlights of the release:
I thought I’d show off some of the highlights of the release:
2. Geospatial Alerts – This is so cool! Monitor geographic areas and get alerts on any changes or updates
3. Favorites – save a favorite map view and share out to your team
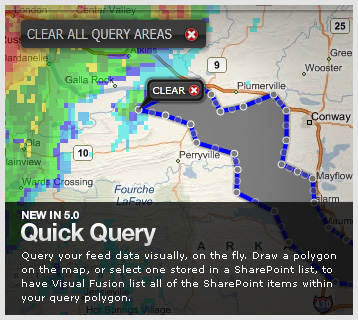
4. Quick Spatial Query – Out of the box, powerful query support
5. Integrated Drawing Tools – contribute to the visualization on the fly
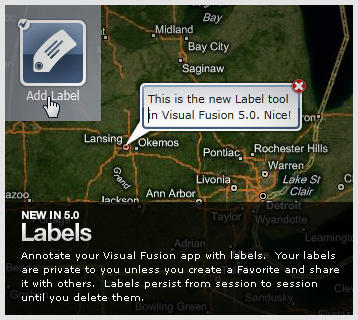
6. Labels – make your mark on the shared visualization
7. Command Ribbon – easily access key commands
This is a longer blog post, and it doesn’t even cover all of the great functionality introduced in Visual Fusion 5.0. Please Contact Us to see more in a tailored demonstration of Visual Fusion.
Quick Views:
We've recently launched version 5.0 of Visual Fusion. In it we emphasize business intelligence and focus on enabling users to create and edit data directly, a tight and seamless integration with SharePoint, and coordinated charting views. So read on about some of the highlights, but before you do...get ready to live.
Business Analytics: Making Data Contextual and Findable


Source: http://www.idvsolutions.com, http://enterpriseready.idvsolutions.com, http://uxblog.idvsolutions.com


Δεν υπάρχουν σχόλια:
Δημοσίευση σχολίου